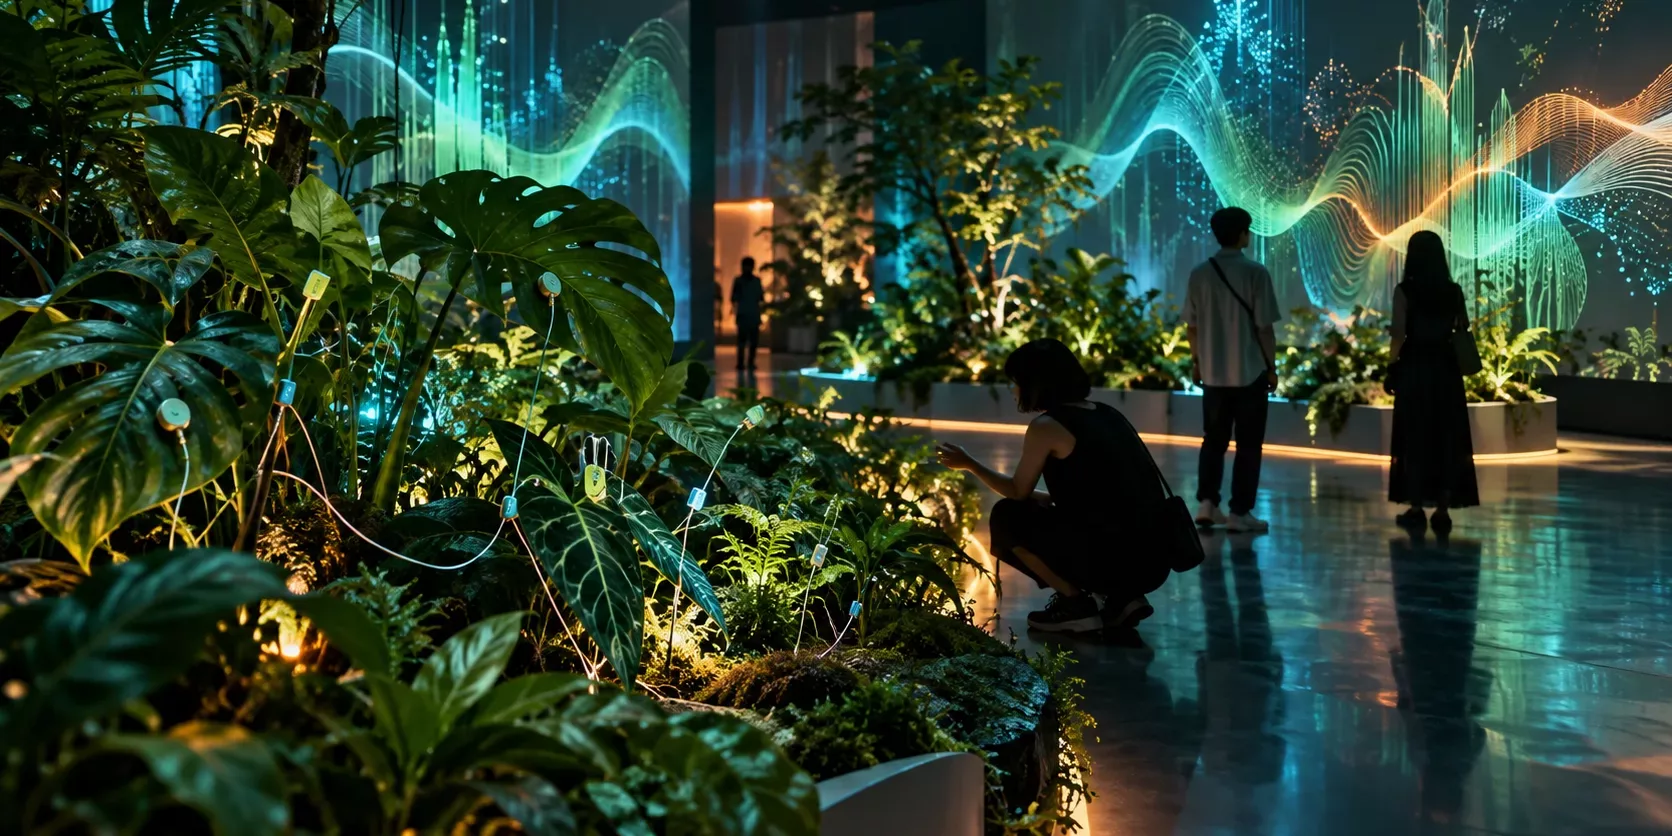
Image: MTECH Digital - AI-generated original illustration — Original editorial illustration by MTECH Digital, created with AI assistance.
Presented in the VISAP 2026 exhibition in Cambridge, Urban Data Orchestra lets visitors combine urban tree and soundscape data using physical controls and real-time audiovisual feedback.
Key takeaways
- Urban Data Orchestra was included in the VISAP 2026 exhibition at MIT Met Warehouse in Cambridge.
- The artwork is credited to Elina Oikonomaki and Lukas Lesina Debiasi.
- It uses New York City's Tree Census and the SONYC soundscape archive as its data basis.
- Visitors arrange physical modules to explore different neighborhoods and seasons through sound and visuals.
- For MTECH, the key transferable pattern is tangible interaction with curated data, not a claimed commercial performance result.
Making urban data playable
Urban Data Orchestra, by Elina Oikonomaki and Lukas Lesina Debiasi, appeared in the VISAP 2026 exhibition programme at the MIT Met Warehouse in Cambridge, Massachusetts. The exhibition was associated with IEEE VIS and opened November 11, within the November 9–15 reporting week.
The official artwork description explains that the installation draws on two New York City datasets: the Tree Census and the SONYC urban soundscape archive. Instead of presenting charts alone, the work lets visitors construct audiovisual compositions from patterns in city life.
Physical controls, digital response
The artists describe a split-console interface with plexiglass modules inspired by audio mixing. Visitors choose neighborhoods and time periods, and combine blocks representing sound categories and tree species. The installation then produces changing visual and sonic arrangements, allowing people to compare environmental conditions through play.
What is and is not documented
The official programme describes the artistic interaction and the datasets, but it does not specify sensor manufacturers, computing hardware, frame rate, latency, cost or audited audience outcomes. The artwork page also mentions a previous presentation at Ars Electronica 2026; the news hook here is its inclusion in the November 11–13 VISAP exhibition, not a claim that the concept debuted that week.
Practical design lessons
- Give visitors a small number of tangible choices with clearly perceivable consequences.
- Show provenance and limits of the datasets used in an installation.
- Design feedback for groups, including people observing rather than touching the controls.
- Prototype interaction timing and the sound environment before deploying in a public venue.
MTECH editorial analysis: this pattern could inspire data-driven brand walls, museum exhibits or ESG storytelling. Translating a dataset into sound and light can make information more approachable, but effectiveness must be validated with the target audience and venue.
Sources and verification
The VISAP artwork page supplies the creators, data sources and interaction concept. The exhibition programme and VISAP 2026 overview corroborate the venue and dates. No visitor counts or hardware benchmarks are inferred.